The original PSPs ranged in area from 405 to 4047 m2, though the majority were less than or equal to 1012 m2. This modest size precludes meaningful studies of spatial patterns, gap dynamics, and demographic investigations of other than the few dominant species, all features of forests critical to understanding succession. For this reason we have also mapped and repeatedly sampled large forest blocks. The 10 largest plots together cover approximately 24 ha of forest and include 38,000 living trees.
| Plot | Download | Metadata | Forest Type | years sampled | times sampled | area (m2) *=increased plot size in 1970's |
total trees observed | current living trees | total saplings observed | current living saplings | total seedlings observed | current living seedlings |
|---|---|---|---|---|---|---|---|---|---|---|---|---|
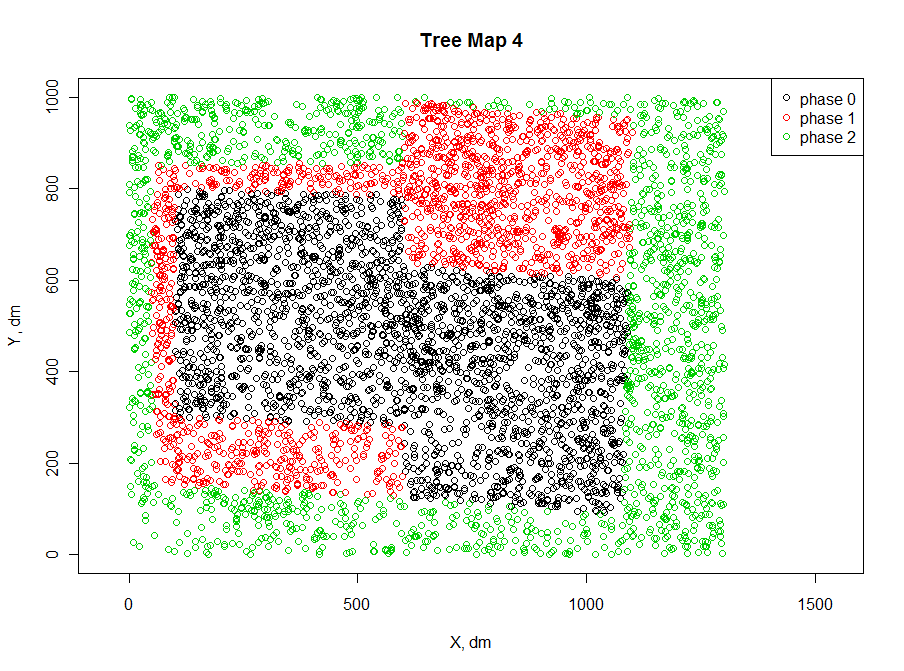
| M4 | csv (zipped) | Metadata | Even-age Pine (80 years) | 1978-2001 | 6 | 13000* map | 6465 | 3214 | 2055 | 945 | 33865 | 4578 |
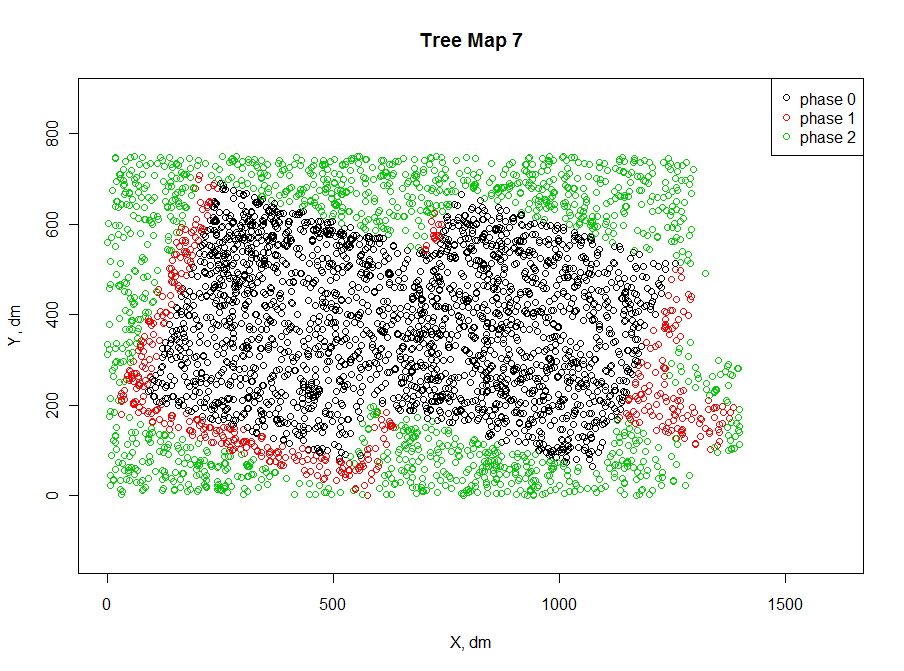
| M7 | csv (zipped) | Metadata | Even-age Pine (100 years) | 1978-2000 | 6 | 9750* map | 4572 | 2605 | 2468 | 739 | 30158 | 1655 |
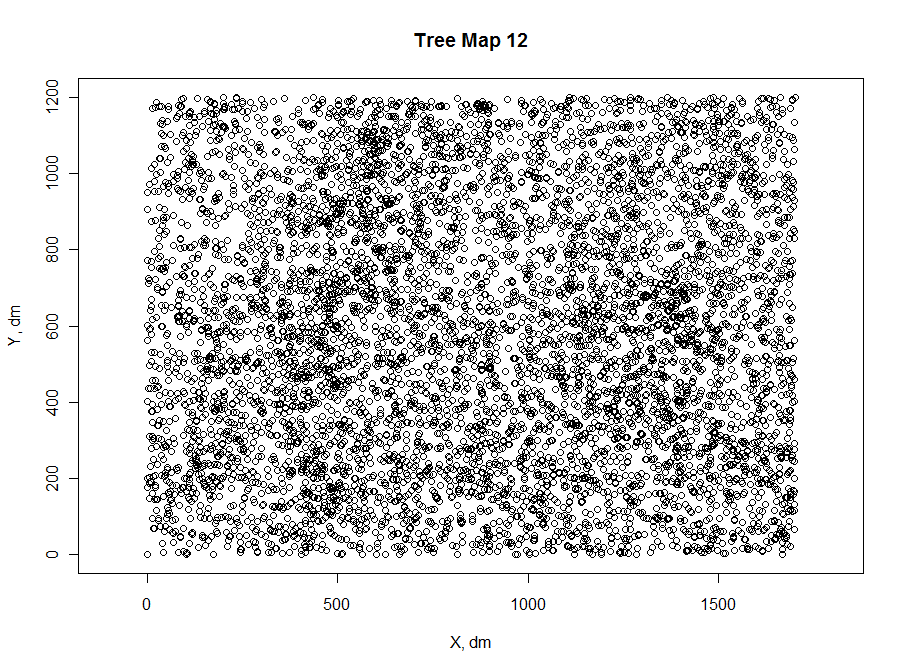
| M12 | csv (zipped) | Metadata | Mixed Hardwoods, Basic | 1978-1997 | 5 | 20400 map | 7677 | 5573 | 1714 | 574 | 11284 | 1133 |
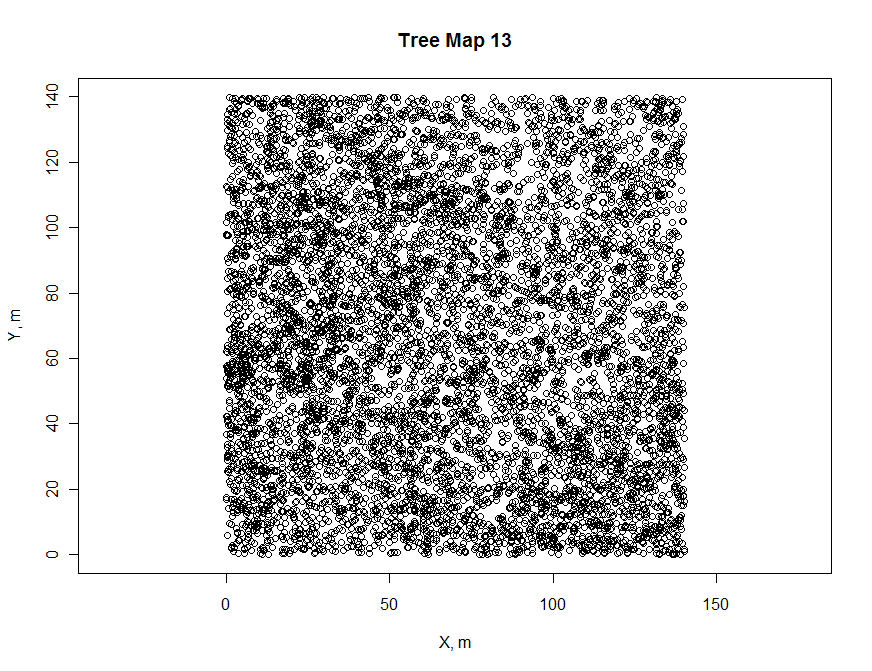
| M13 | csv (zipped) | Metadata | Mixed Hardwoods, Acidic | 1952-2000 | 7 | 19600 map | 9287 | 4370 | 1454 | 536 | 6814 | 1609 |
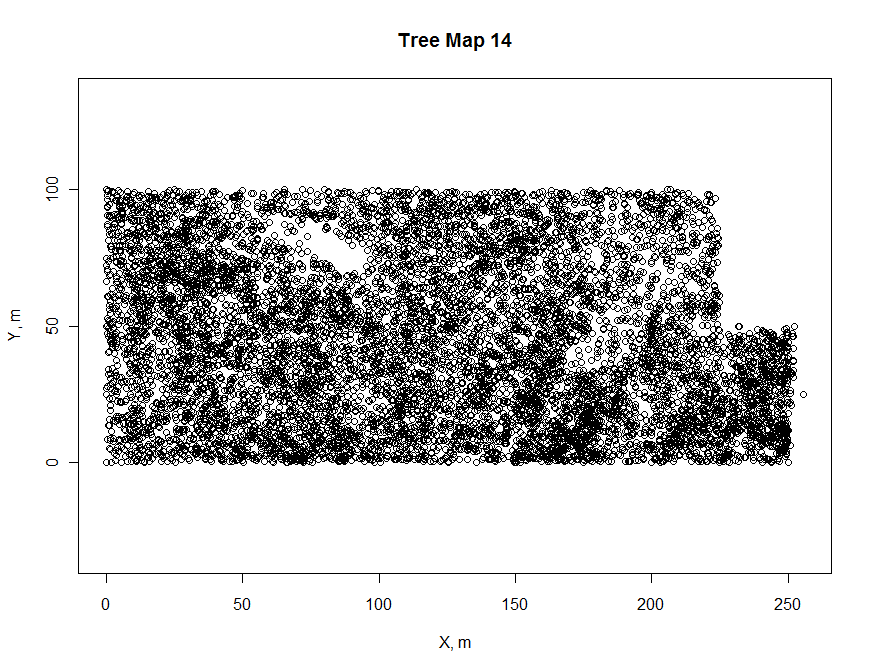
| M14 | csv (zipped) | Metadata | Bottomland Hardwoods | 1986-2001 | 5 | 23750 map | 11017 | 8790 | 2742 | 1069 | 908 | 457 |
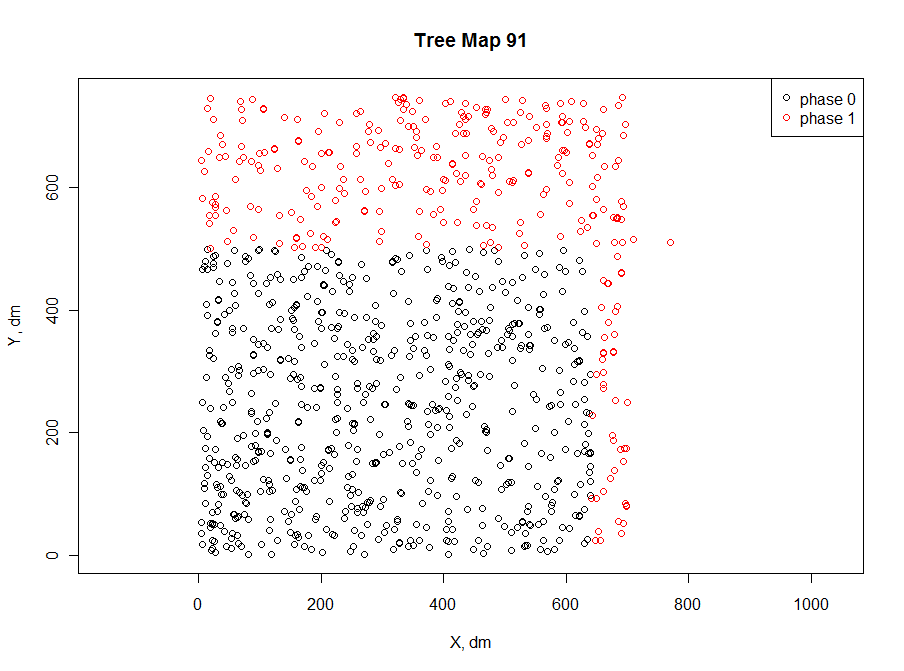
| M91 | csv (zipped) | Metadata | Mixed Hardwoods | 1984-1998 | 4 | 5250* map | 1014 | 789 | ||||
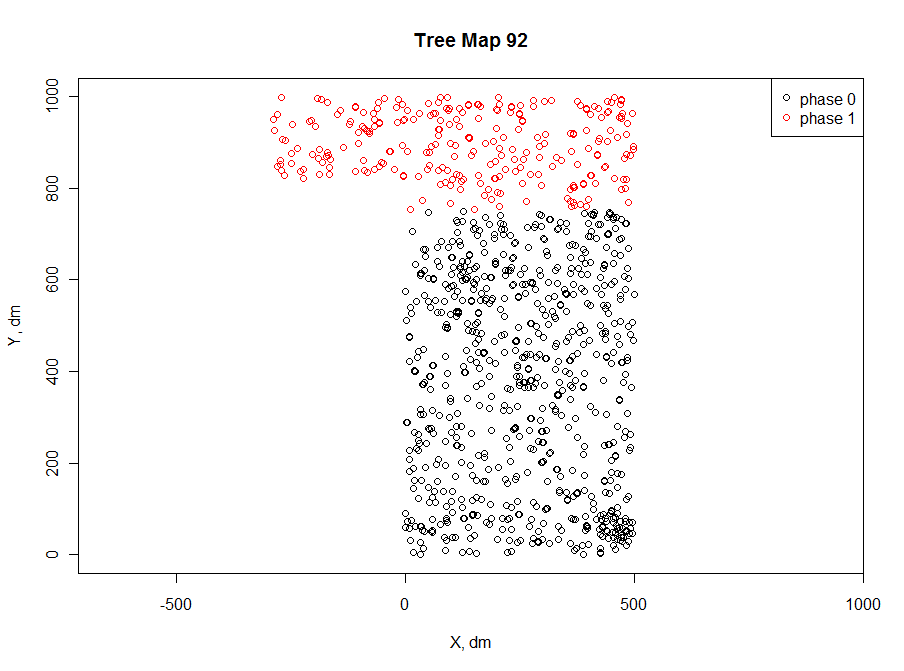
| M92 | csv (zipped) | Metadata | Chestnut Oak | 1984-1999 | 4 | 5000* map | 1072 | 770 | ||||
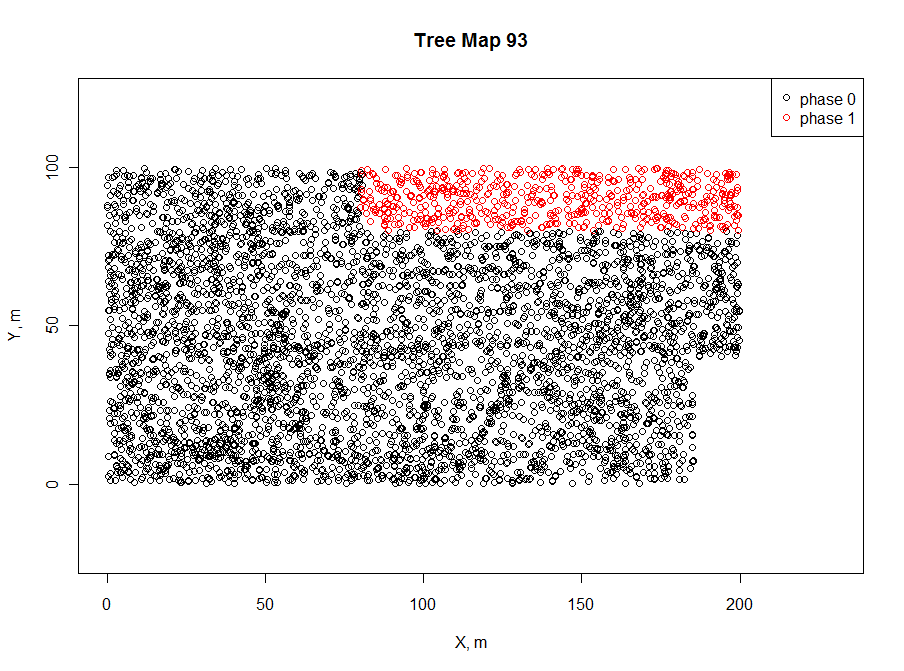
| M93 | csv (zipped) | Metadata | Mixed Hardwoods | 1986-1998 | 3 | 15000* map | 5385 | 3814 | ||||
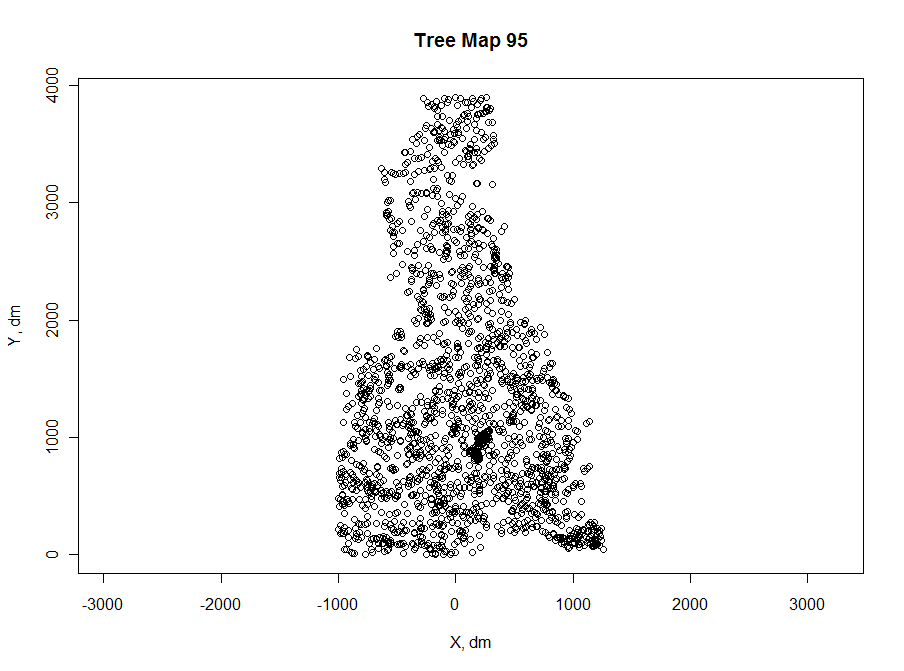
| M95 | csv (zipped) | Metadata | Longleaf Pine | 1985-1997 | 4 | 56500* map | 2020 | 1503 | ||||
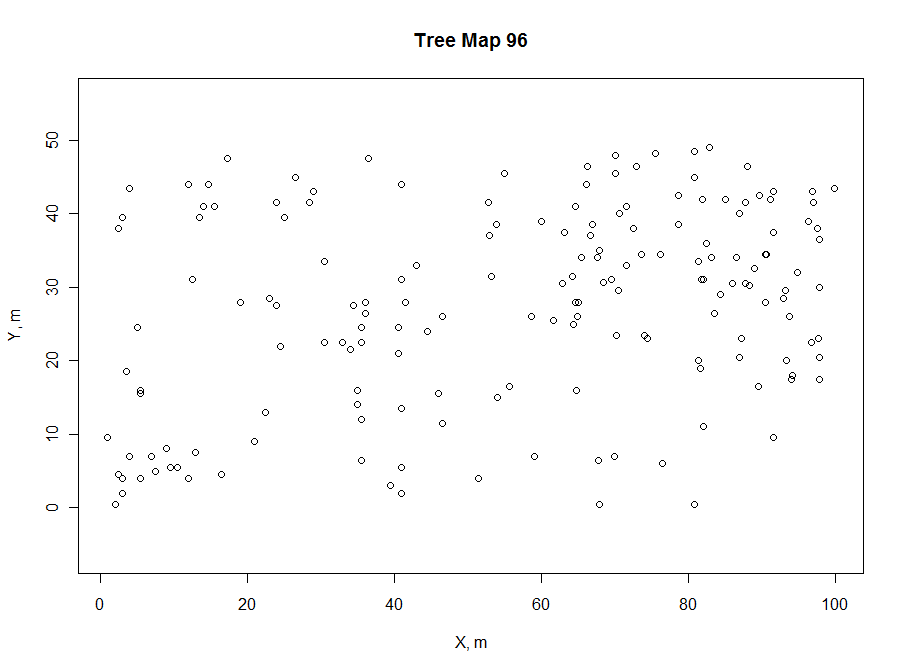
| M96 | csv (zipped) | Metadata | Longleaf Pine | 1983-1996 | 5 | 5000 map | 171 | 162 | ||||
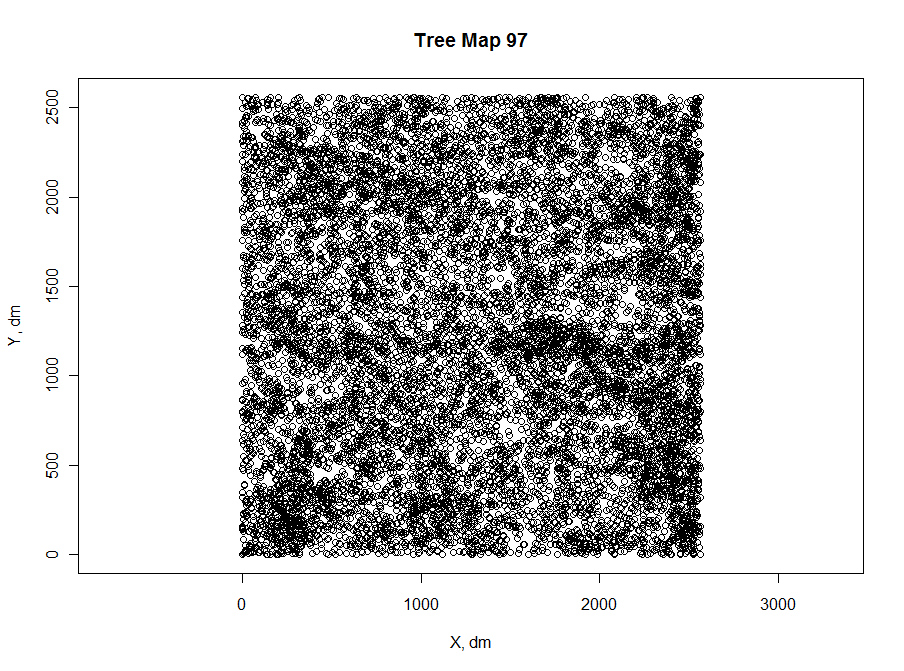
| M97 | csv (zipped) | Metadata | Mixed Hardwoods | 1990-1998 | 2 | 65536 map | 12975 | 10243 |