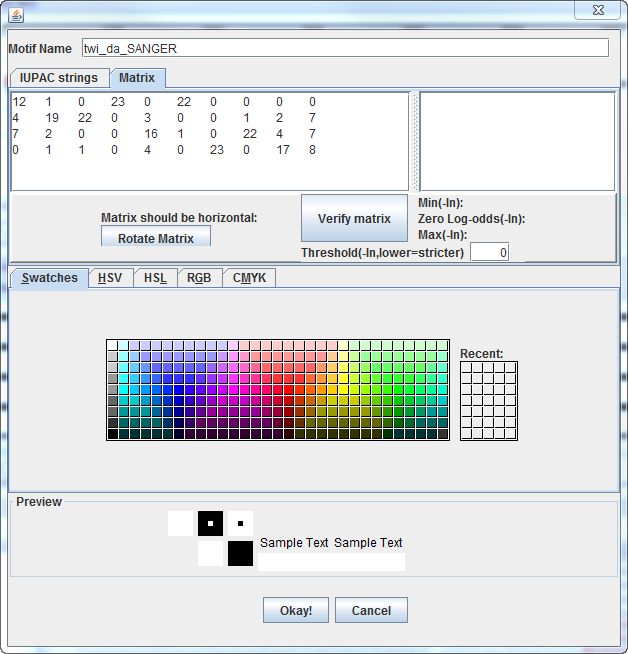
After the matrix has been entered, verify that Twine recognizes it
as the proper format, by clicking the "Verify matrix" button.
In addition to verifying that the matrix is in the proper format,
converting a Count Matrix to a Frequency Matrix,
and generating a Sequence Logo representation of the matrix,
"Verify matrix" calculates the Maximum (most stringent) and
Minimum (least stringent) possible score of the matrix.
The scores are the product of the frequencies observed at each
position in true binding sites,
so the scores would be between 0 (worst) and 1 (best).
However, because most scores will be very small, they are
expressed in negative natural logarithm,
so 0 is the best possible score (because ln(0)=1, but most
matrices will not have a zero score possible).
A threshold can be specified within these bounds to cutoff matches
that are too weak.
Twine currently does not implement log-odds ratios as the scoring
mechanism (dividing each frequency
by the background frequency of that nucleotide), but Twine does
calculate the matrix score that would
be equivalent of a log-odds score of 0, which is a sequence that
is as likely to appear in a real binding site
as it is to appear in random background sequence (with
equiprobable nucleotides).
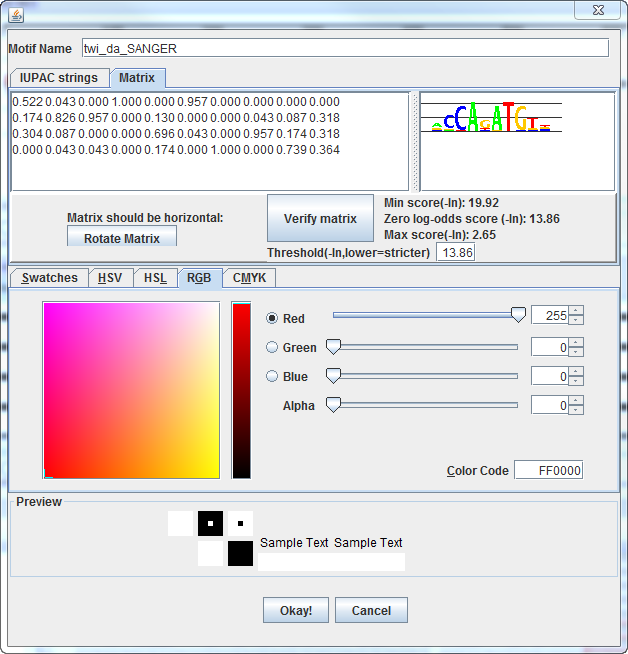
Match strength is displayed by opacity, which is defined by the
alpha component of RGB color.
The minimum opacity of displayed matches can be controlled by
altering the alpha component,
either when inputting the motif, or in the Motif Settings panel.
In the PFM Motif Settings panel, a slider allows dynamic testing
of thresholds,
so you can play with the score that seems to give a meaningful
compromise between stringency and specificity.
The upper threshold defines the worst match score that will be
completely opaque,
and the lower threshold defines the worst match score that will be
drawn at all.
The red bar between the two sliders displays the gradient of
opacity for matches between these two thresholds.
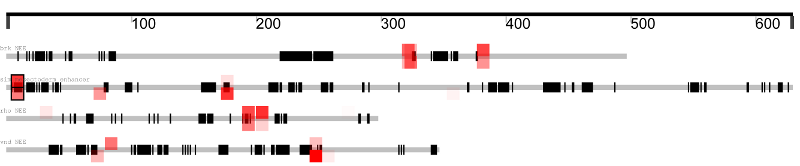
For this Twist binding matrix,
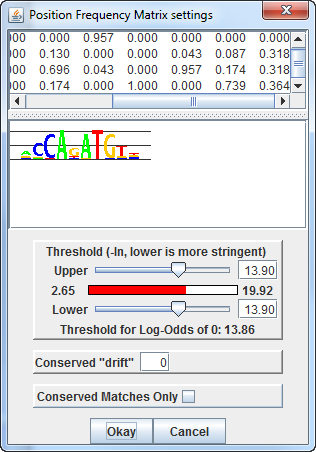
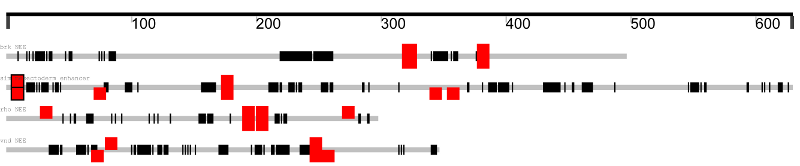
Which results in a display of matches like this:
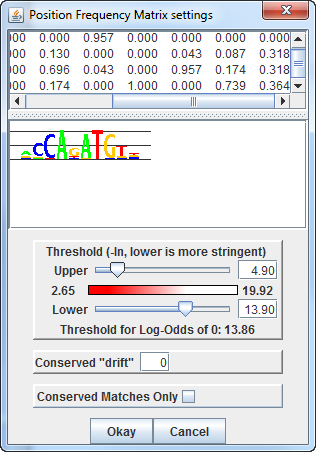
However, setting the upper threshold to the strongest binding site
in your sequences (empirically determined),
and setting the lower threshold to some weaker score (the score
equivalent to a log-odds of 0, for example),
Will generate a gradient of opacity, as seen by the graded red bar
between the sliders.
This results in matches being displayed like this:
Stronger matches are opaque, weak matches are more transparent,
and conserved matches are boxed.
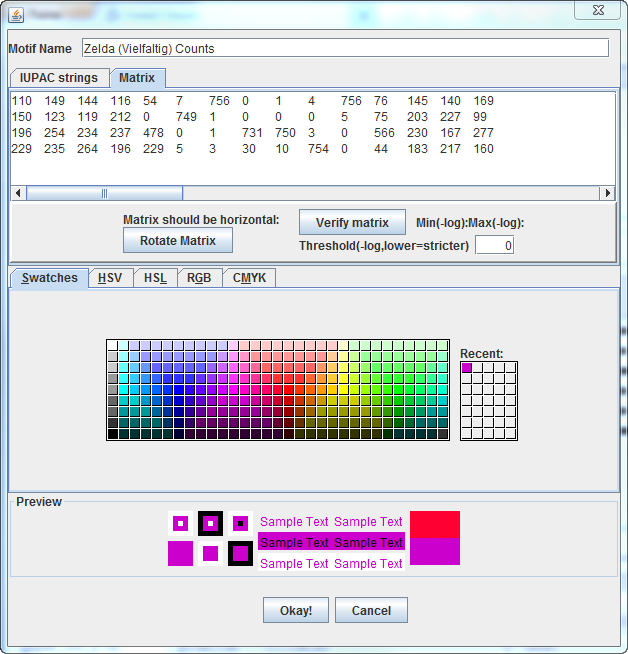
Examples (matrix from Fly Factor Survey, from Solexa Sequencing of
Zelda/Vielfaltig data):
A Position Count Matrix, which will be converted to a Frequency
Matrix by Twine (
screenshot
here):
110 149 144
116 54 7
756 0 1
4 756 76
145 140 169
150 123 119
212 0 749
1 0 0
0 5 75
203 227 99
196 254 234
237 478 0
1 731 750
3 0 566
230 167 277
229 235 264
196 229 5
3 30 10
754 0 44
183 217 160
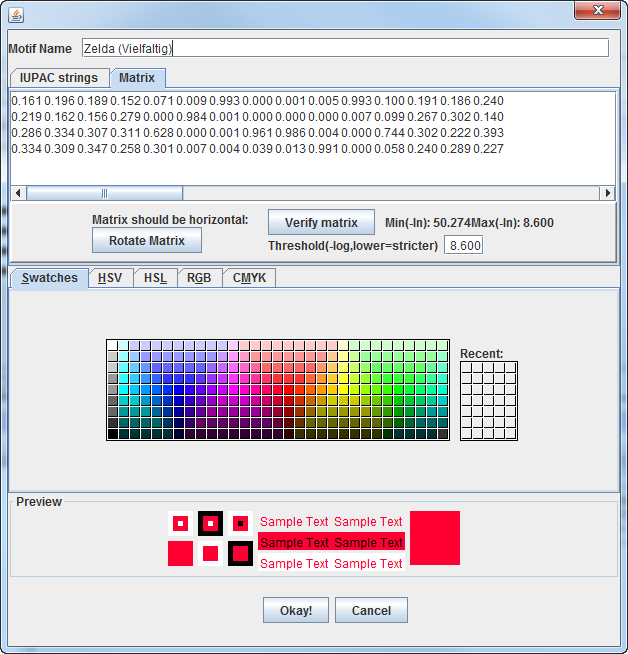
A Position-Specific Probability Matrix (or Position Frequency
Matrix,
screenshot
here):
0.161 0.196
0.189 0.152
0.071 0.009
0.993 0
0.001 0.005
0.993 0.1
0.191 0.186 0.24
0.219 0.162
0.156 0.279
0 0.984
0.001 0 0
0 0.007
0.099 0.267
0.302 0.14
0.286 0.334
0.307 0.311
0.628 0
0.001 0.961
0.986 0.004
0 0.744
0.302 0.222 0.393
0.334 0.309
0.347 0.258
0.301 0.007
0.004 0.039
0.013 0.991
0 0.058 0.24
0.289 0.227
Several databases have thousands DNA binding protein matrices,
including
Jaspar,
Transfac,
and
Fly Factor Survey.
The default set of plugins includes a program that will convert
Jaspar-type horizontal count matrices (also compatible with Fly
Factor Survey) into Twine Motif Library files.