Determining whether the set of motif matches found in your
sequence of interest is meaningful (or at least statistically
significant) is a decades-old problem, and an area of active
research.Twine takes a fairly straight-forward approach to
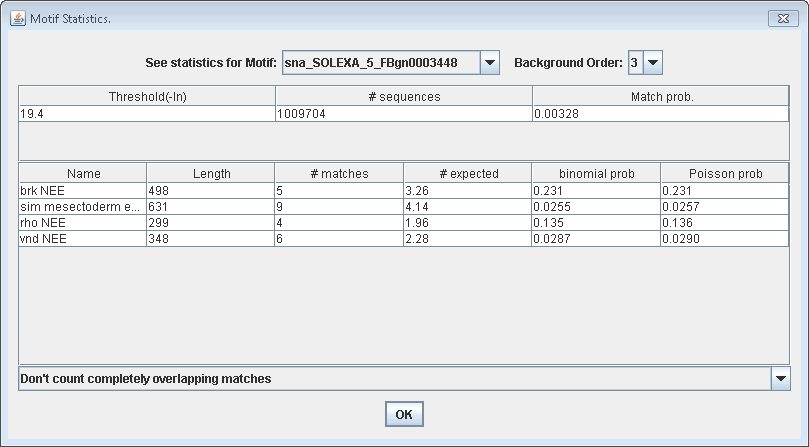
calculating a "significance score" that will give a first
approximation as to whether the observed number of binding sites
is actually enriched compared to what would be expected in
background sequence, which can be viewed by clicking "Analyze >
Motif Statistics".
The supplementary material to ClusterDraw
(Papatsenko, Bioinformatics 2007) gives a clear explanation
both of determining the expected frequency of a given motif (IUPAC
or matrix), and how to use the binomial distribution to calculate
a P-value for the observed number of binding sites, compared to
what was expected. It's quite well-written, you should read it.
With an IUPAC motif, it's fairly straightforward: Assuming 60%
A/T content, the sequence ACCT would have a frequency of
.3*.2*.2*.3=.0036. If one mismatch is allowed, then each
permutation is calculated (ACCT, NCCT, ANCT,ACNT,ACCN, where NCCT
is ACCT, CCCT, GCCT,and TCCT), duplicates removed, and the
frequency for each sequence summed to determine the cumulative
expected frequency. If multiple IUPAC words were included for a
motif with different lengths, any literal sequence from a longer
motif that completely contains a literal sequence from a shorter
motif is excluded to prevent over-counting.
Calculating the expected frequency for matrix matches at a given
threshold requires traversing each of the 4^N sequences, and as
long as the sequence is above the threshold, including it in the
cumulative frequency for the motif. For large motifs with
low-information positions, this can number in the millions (so you
might notice a slight delay after clicking, or you could trim the
matrix).
In either case, higher-order background frequencies can be used
to better reflect random sequence, using a Markov background
chain, 0-3rd order. Twine uses the file format output by a utility
included in the MEME suite.
With both observed and expected number of sites within a given
enhancer counted/calculated, Twine uses the binomial probability
to consider all the different possible combinations of sites that
could give the observed count, and determines where on the
binomial distribution the observed count lies. An important caveat
is mentioned by Papatsenko (2007) about how the binomial
distribution isn't good for overlapping sites (a factor can't
simultaneously occupy both sites at once), so the threshold needs
to be sufficiently stringent to avoid this. Some motifs
essentially always find palindromic sequences, so an optional
filter prevents those duplicates from being counted as "observed".
It turns out that the Poisson distribution does a really good
approximation of the binomial distribution for values commonly
observed, so is included to show this.
In the future, I plan on incorporating other statistical
measures, including Markov Chain Monte Carlo.